
San Diego, CA (May 16, 2013) – The latest survey data on how California’s plug-in electric vehicle ( PEV) drivers use and charge their cars indicates that the majority of respondents have high overall satisfaction with their choice to go electric and use their PEVs as their primary transportation. Under funding from the California Air Resources Board, the California Center for Sustainable Energy (CCSE) conducts ongoing PEV owner surveys as part of the Clean Vehicle Rebate Project.
The CCSE study shows PEV owners drive their cars an average of nearly 29 miles per day and charge their vehicles primarily at night when electrical rates are lowest. This type of data is valuable to the auto industry, utilities and city planners in further developing the market and infrastructure for electric vehicles.
The study is the largest and most-detailed survey of PEV drivers in the nation, supplying details on purchasing motivations, charging behavior, vehicle use, fueling costs and access to public and residential charging.
California is the nation’s largest PEV market with some 30,000 vehicles, roughly 35 percent of the U.S. total, with sales adding about 2,500 additional cars in the state each month. California sales of PEVs tripled in 2012 over 2011 sales, and during the fourth quarter 2012, sales of PEVs reached more than two percent of all new cars purchased or leased in the state.
“With roughly 1 of every 40 new car transactions in the state being a plug-in electric vehicle, it clearly shows California has established itself as a national and worldwide leader in the promotion and deployment of alternative fuel and zero-emission automotive technologies,” said Mike Ferry, CCSE’s transportation program manager. “The PEV market in California has grown tremendously during the past six months, and with the recent addition of several new models, we need to continue to better understand what is driving and shaping this exciting market.”
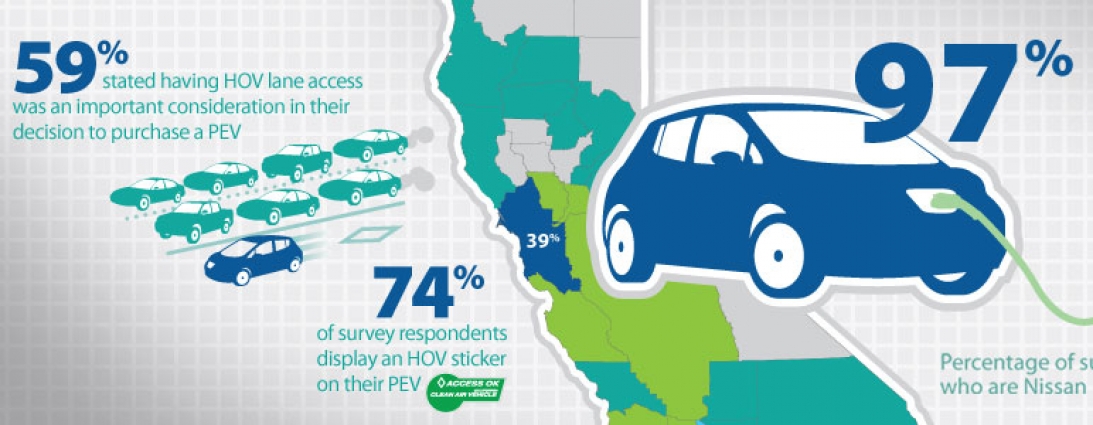
The results of the survey confirm the early market success of PEVs and identify the ongoing challenges and barriers to wider consumer adoption. Some of the highlights from the latest survey include the following.
- The state’s consumer rebate was as an important motivating factor in the purchase decision for 95% of respondents.
- PEV driver satisfaction is high, with 92% of respondents reporting overall satisfaction and driving an average of 910 miles per month.
- Driver satisfaction with public charging infrastructure remains low, but it is improving. Between February and October 2012, satisfaction increased from 17% to 23%.
- Access to workplace charging is available to 37% of survey respondents; however, 66% reported using it less than once per week when charged usage fees.
- For occasional public charging outside the home, two-thirds of respondents reported a willingness to pay up to $1.00 per hour with less than one-third willing to pay $1.50 per hour. For comparison, home charging can average as low as $0.60 per hour, equivalent to less than $2.50 per gallon of gasoline.
- For daily charging outside the home, only 16% of respondents expressed a willingness to pay up to $1.25 per hour, but 43% were willing to pay $1.00.
- While most respondents expressed overall satisfaction with their vehicles, 40% were dissatisfied with their electric range and 57% indicated that it would take a range of 150 miles or more to be extremely satisfied.
A leader in electric and alternative fuel transportation planning and programs in California, CCSE serves as the administrator of the Air Resources Board’s Clean Vehicle Report Project. Since the project’s inception in 2010, CCSE has issued nearly $49 million in vehicle incentives to some 22,000 consumers and helped to educate more than 100,000 Californians on the availability and benefits of zero-emission vehicles.
The full results of the PEV ownership survey and accompanying infographics are available online at CCSE’s website at www.energycenter.org/pevsurvey. CCSE also offers an online map depicting region-specific PEV adoption rates based on the number of rebates issued by ZIP code and the type of PEV purchased. The rebate map is available at www.energycenter.org/CVRPRebateMap.