

With the current on-going drought conditions in California, water efficiency is a high priority – both to reduce water use and curtail energy costs.
While extensive efforts have been made to develop technologies and appliances that use less water, one source of significant savings is continually overlooked: leaking distribution infrastructure. When water leaks out of pipes and fixtures and does not reach its end use, the energy that was used to treat and transport the water is also wasted. According to a 2005 California Energy Commission report, water-related energy consumption accounts for nearly 20 percent of all electricity used in the state.
The water-energy connection and opportunities to reduce future losses
What does it add up to?
The American Water Works Association (AWWA) reports that nationwide water agencies have a median water loss of 46 gallons per service connection per day (GSCD) between treatment facilities and the consumer. While the San Diego region is doing slightly better, at about 39 GSCD, every drop counts and more can be done to save this precious resource and the energy it requires.
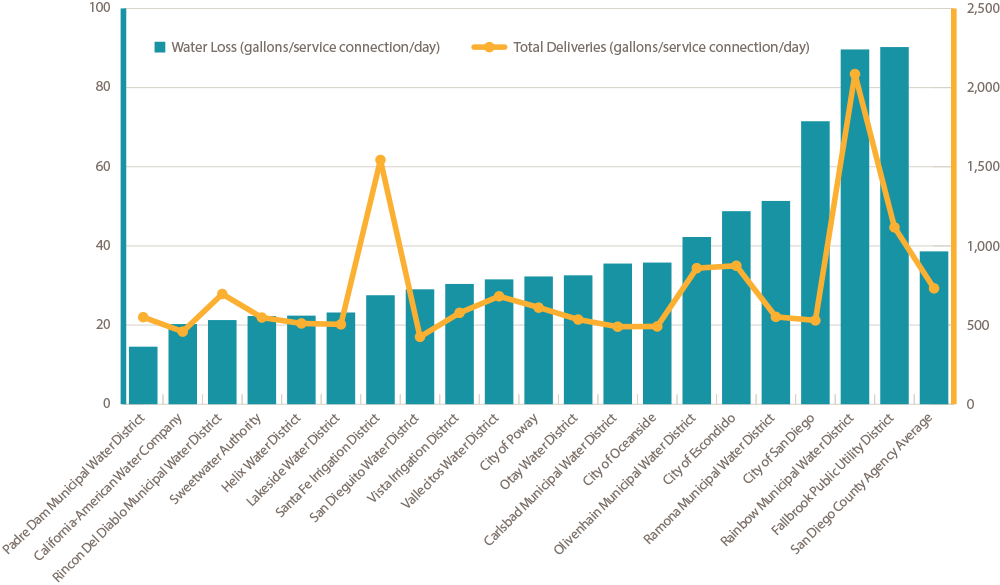
Water districts are mandated to report water loss rates to the state every five years via their urban water management plans. The most recent data for districts in the San Diego region show losses between 14.5 and 90.2 GSCD reported in 2010 (see figure). While better than the national average, these losses total 37,345 acre-feet a year (more than 12 billion gallons) and waste at minimum 55 million kilowatt-hours,1 which is enough to power more than 9,000 San Diego households for a year2 based on estimates of minimum energy requirements of the current water source portfolio.
Water System Losses vs. Total Deliveries
Select Water Districts, 2010
Water system loss vs. total deliveries in 2010 retail water districts in the San Diego region that produce annual urban water management plans.
Fortunately, following passage of Senate Bill 555 in October 2015, water audits and loss reporting will happen annually starting in 2017, and the state will set performance standards for allowable leak volumes. This law will automatically prompt water companies and districts to measure these leaks and implement methods for locating and repairing them.
Best practices can help
Effective computer systems for monitoring leaks are available that can increase system efficiency by prioritizing and optimizing pumping based on up-to-date electricity rates and controlling water line pressure, which reduces leakage and line breaks. However, according to Bloomberg, “only about 20 percent of utilities worldwide – and fewer still in the U.S. – are using smart sensors in their infrastructure.”
Preventing water infrastructure failures by replacing parts before the end of their service life is better than waiting for expected leaks. According to inewsource, there were 306 main breaks in the City of San Diego between January 2012 and September 2015, wasting approximately 35 million gallons (110 acre-feet) of water. The California Department of Public Health requires replacement of at least 10 miles of cast-iron water mains per year, and San Diego had replaced around 50 miles of these by 2012, with 129 remaining through 2017.
Another strategy for avoiding infrastructure failure is advanced management of pressures in the pipe network, which generally proves to be far less expensive than infrastructure replacement.
Prioritize monitoring systems
Moving forward, it is recommended San Diego and California take advantage of AWWA best practices and new technologies to update current infrastructure and reduce water lost in distribution. Senate Bill 555 is the first step toward implementing monitoring systems throughout California and setting performance standards, but water districts need to prioritize advanced monitoring systems to save on costs as well as reducing waste of precious natural resources.
------
1 "San Diego’s Water Sources: Assessing the Options,” (July 2010), Equinox Center and Fermanian Business & Economic Institute.
2 SDG&E area consumption per household estimate (2013).


